


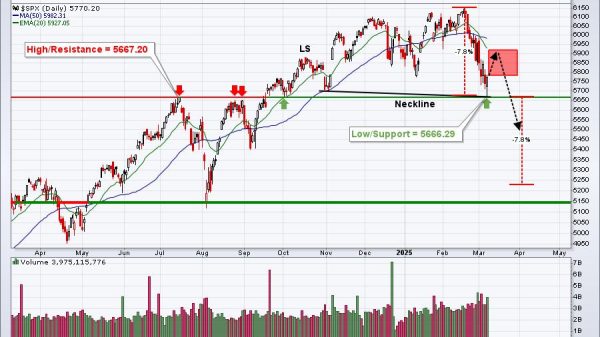


In what can be called an indecisive week for the markets, the Nifty oscillated back and forth within a given range and ended the week on a flat note. Over the past five sessions, the Nifty largely remained within a defined range. While it continued resisting the crucial levels, it also failed to develop any definite directional bias throughout the week. The Nifty stayed and moved in the 585-point range. The volatility significantly declined. The India VIX came off by 15.77% to 13.69 on a weekly note. While trading below crucial levels, the headline index closed flat with a negligible weekly gain of 51.55 points (+0.22%).
A few important technical points must be noted as we approach the markets over the coming weeks. Both the 50-Day and 50-Week MA are in very close proximity to each other at 23754 and 23767, respectively. The Nifty has resisted to this point, and so long as it stays below this level, it will remain in the secondary corrective trend. For this secondary trend to reverse, the Nifty will have to move past the 23750-24000 zone, one of the critical market resistance areas. Until we trade below this zone, the best technical rebounds will face resistance here, and the markets will remain vulnerable to profit-taking bouts from higher levels. On the lower side, keeping the head above 23500 will be crucial; any breach of this level will make the markets weaker again.Monday is likely to see a quiet start to the week; the levels of 23700 and 23960 will act as resistance levels. The supports come in at 23350 and 23000 levels.
The weekly RSI stands at 46.20. It remains neutral and does not show any divergence against the price. The weekly MACD is bearish and stays below its signal line. A Spinning Top occurred on the candles, reflecting the market participants’ indecisiveness.
The pattern analysis weekly charts show that after violating the 50-week MA, the Nifty suffered a corrective decline while forming the immediate swing low of 22800. The subsequent rebound has found resistance again at the 50-week MA at 23767, and the Nifty has retraced once again from that level. The zone of 23700-24000 is now the most immediate and major resistance area for the Nifty over the immediate short term.
Unless the Nifty crosses above the 23700-24000 zone, it will remain in a secondary downtrend. On the lower side, keeping head above the 23500 level will be crucial; any violation of this level will take Nifty towards the 23000 mark. The markets may continue to reflect risk-off sentiment overall. Given the current technical setup, remaining highly selective while making fresh purchases would be prudent. All technical rebounds should be used more to protect gains at higher levels. At the same time, staying invested in stocks with strong or at least improving relative strength while keeping overall leveraged exposures at modest levels is important. A cautious and selective approach is advised for the coming week.
Sector Analysis For The Coming Week
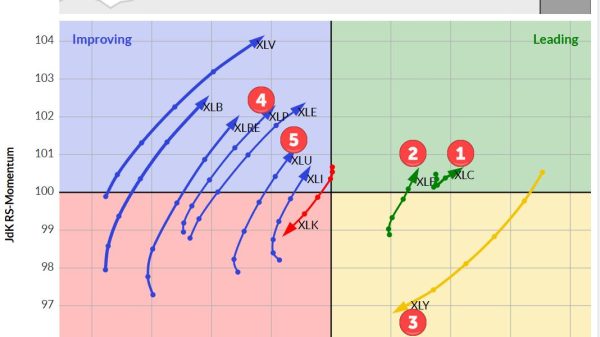
In our look at Relative Rotation Graphs®, we compared various sectors against CNX500 (NIFTY 500 Index), which represents over 95% of the free float market cap of all the stocks listed.
Relative Rotation Graphs (RRG) show defensive and risk-off setups building up in the markets. Nifty Bank, Midcap 100, and Realty Indices are inside the leading quadrant. But all these pockets show a sharp loss of relative momentum against the broader markets.
The Nifty Financial Services Index has slipped inside the weakening quadrant. The Nifty Services Sector and IT indices are inside the weakening quadrant. The Pharma Index is also inside this quadrant but is seen as attempting to improve its relative momentum.
The Nifty Media, Energy, and PSE indices are inside the lagging quadrant.
The Nifty FMCG, Consumption, and Commodities groups have rolled inside the improving quadrant, indicating a likely onset of the phase of relative outperformance. The Auto, Infrastructure, Metal, and PSU Bank indices are inside the improving quadrant. Among these groups, the PSU Bank Index is seen rapidly giving up on its relative momentum.
Important Note: RRG™ charts show the relative strength and momentum of a group of stocks. In the above Chart, they show relative performance against NIFTY500 Index (Broader Markets) and should not be used directly as buy or sell signals.
Milan Vaishnav, CMT, MSTA
Consulting Technical Analyst
www.EquityResearch.asia | www.ChartWizard.ae