


We just wrapped up a busy week jam-packed with key economic data and big tech earnings. And we have some positive news: the market held up pretty well. May is off to a good start.
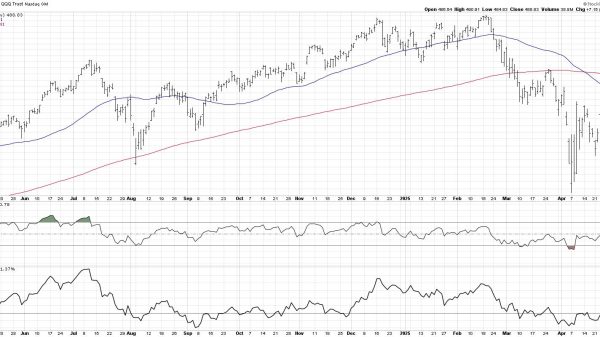
Strong earnings from META Platforms (META) and Microsoft (MSFT) gave the stock market a boost. Together, their strong performance helped the Nasdaq Composite ($COMPQ) break above its 50-day simple moving average (SMA).
On Friday, the rally got an extra shot in the arm from a better-than-expected jobs report—177,000 jobs added vs. 135,000 expected. That helped fuel a market-wide rally, with all the major indexes ending the week in positive territory. The Dow Jones Industrial Average ($INDU) closed up 1.46%, the S&P 500 ($SPX) up 1.42%, and the Nasdaq Composite ($COMPQ) up 1.41%.
A quick glance at the Equities panel (US Indexes tab) in the Market Summary page shows that the S&P 500, Dow Industrials, Russell 1000, and the Wilshire 5000 had nine consecutive up days. This is quite the reversal after trade war outcomes spooked investors. The weekly streak isn’t too shabby either, with many indexes displaying four consecutive up streaks. More indexes are now trading above their 50-day moving averages compared to a few days ago.
What Does This Mean Going Forward?
After a negative statistic in the Q1 GDP growth, the strong jobs report put recessionary fears in the rearview mirror. However, this also lowers the chances of the Federal Reserve cutting interest rates in the May FOMC meeting. And looking at the CME FedWatch Tool, the probability of a rate cut in June has dropped to 36.4%, so it may be July before we see a rate cut. But this scenario could change between now and June.
Does this week’s price action mean the equity market is reversing? One thing is clear: The situation is much more positive than it was three weeks ago. But to get an objective view, it’s best to focus on the charts.
The Technical PoV
The daily chart of $SPX below shows that Friday’s close basically wipes out the “post Liberation Day” losses. Essentially, all the volatile action that took place in the last month was an emotional reaction to the uncertainty that investors were battling against. It was an emotional roller coaster. Now that the S&P 500 is back to the high of April 2, does it mean things have returned to business as usual?
FIGURE 1. DAILY CHART OF S&P 500. The index closed at around the same level it did on Liberation Day. Chart source: StockCharts.com. For educational purposes.
Seasonally, May is a good month in the stock market, as are June and July. You can see this in the seasonality chart of the S&P 500. The data supports some of the price action we’re seeing, especially among sectors and industry groups.
Sector Snapshot
All 11 S&P sectors closed in the green on Friday. For the week, Industrials, Technology, and Financials were the leading sectors. It’s interesting to note that Friday’s leading sector, Financials, is showing signs of recovery after the April fall. The daily chart of the Financial Select Sector SPDR (XLF) shows the ETF trading above its 50- and 200-day SMAs. Its relative strength index (RSI) is also rising.
FIGURE 2. DAILY CHART OF XLF. The ETF broke above its 50-day moving average and its relative strength is also rising. Chart source: StockCharts.com. For educational purposes.
Of the three, the Technology sector is technically the weakest. It’s trading below its 200-day SMA, and its 50-day SMA is below its 200-day SMA. To see strength return to the broader market, the Technology sector needs show technical strength.
The Nasdaq Composite Bullish Percent Index ($BPCOMP) is at 46.52. It showed a reversal from a level just above 20 and crossed above 30, indicating a bull alert. A cross above 50 would be a favorable bull signal.
FIGURE 3. NASDAQ COMPOSITE BULLISH PERCENT INDEX. After a sharp reversal from above 20, $BPCOMPQ crossed above the 30 level and is approaching the 50 level. Chart source: StockCharts.com. For educational purposes.
Keep an eye on this chart, since a break above 50 could be an early signal of improving breadth in the Nasdaq Composite.
At the Close
While the stock market’s price action seems to have regained some of its momentum, there needs to be more confirmation to suggest a trend reversal. Keep an eye on the charts of the broader indexes, sectors, and the BPIs. Look for technical indicators to confirm the rally’s strength and keep an eye on interest rate expectations.
End-of-Week Wrap-Up
S&P 500 up 2.92% on the week, at 5686.67, Dow Jones Industrial Average up 3.0% on the week at 41,317.43; Nasdaq Composite up 3.42% on the week at 17,977.73.$VIX down 8.86% on the week, closing at 22.64.Best performing sector for the week: IndustrialsWorst performing sector for the week: EnergyTop 5 Large Cap SCTR stocks: Palantir Technologies, Inc. (PLTR); Duolingo Inc. (DUOL); Summit Therapeutics PLC (SMMT); MicroStrategy (MSTR); Roblox Corp (RBLX)On the Radar Next Week
Earnings season continues with Berkshire Hathaway (BRK-B), Palantir Technologies (PLTR), Taiwan Semiconductor Manufacturing Company (TSM), Novo Nordisk (NOVO-B.CO), Ford (F), Advanced Micro Devices (AMD), and several others reporting.ISM Services PMIFed Interest Rate Decision/Press ConferenceFed speeches from Kugler, Goolsbee, Waller, Williams, and others on FridayDisclaimer: This blog is for educational purposes only and should not be construed as financial advice. The ideas and strategies should never be used without first assessing your own personal and financial situation, or without consulting a financial professional.