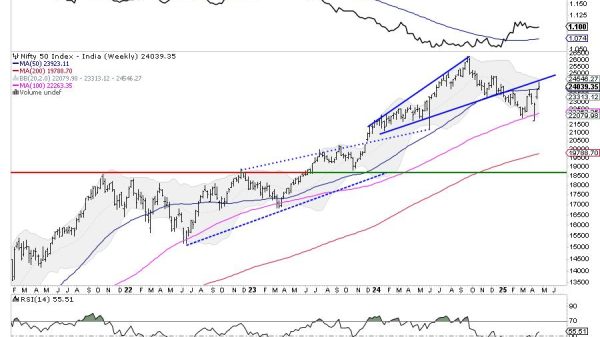
This week will be the biggest week of earnings season and yes, all eyes will be on the heavy-hitters: META, AMZN, MSFT, and AAPL. These names dominate headlines, and their charts are practically seared into our brains.
But let’s look at some solid companies that might fly under the radar but deserve some attention.
First Up, Coca-Cola Co. (KO)
KO shares have been a safe haven and steady gainer during these uncertain times. Shares are up over 15.5% year-to-date as the consumer staple giant and Warren Buffett’s favorite stock outperforms the overall market.
However, coming into this week’s earnings release, momentum seems to be fizzling out. Shares of rival PepsiCo. (PEP) missed the mark and traded lower. The biggest component of the Consumer Staples Select Sector SPDR ETF (XLP), Procter & Gamble (PG), also fell after mixed results.
Last week, investors shifted back into Technology and Consumer Discretionary and away from Consumer Staples. Shares of KO also fell as a result and now sit at an interesting level heading into its earnings release.
FIGURE 1. DAILY CHART OF COCA COLA CO. Note the saucer pattern.
Technically, shares had formed one of my favorite reversal patterns over the last year—a saucer bottom. This saucer bottom did not resolve to the upside and got faked out on “Liberation Day”. That drop quickly reversed as shares again tried to break out from this pattern. Yet again, they are struggling to do so as momentum wanes.
The safe trade in KO has lost momentum on each rally, as seen in the lower highs of its relative strength index (RSI). This bearish divergence is cause for concern as price hits a crossroads into earnings.
The upside move may be limited for now, and shares could retreat to between $67 and $70. After last quarter’s report, shares broke out to the upside and climbed higher. It will be critical for the bulls to see shares stay above $71/$72 for a continuation of this recent run.
For now, the stock has fallen flat, and if the rotation back into tech continues, it may take time for KO to take another leg higher.
Next Up, Visa, Inc. (V)
V has been another outperformer relative to its sector and the overall market. Shares are up 6.1% year-to-date and 22% over the last 52 weeks.
What should investors watch for in Tuesday’s report? Consumer spending, especially in travel and dining—areas where Visa often sees the most activity. Have investors changed their tune given tariff uncertainty and potential price swings, or have they rushed to spend due to any potential increases?
FIGURE 2. DAILY CHART OF VISA, INC. The stock is holding key support level but is making lower highs.
Technically, we are looking at a two-year daily chart to show the longer-term uptrend. That helps us put the recent weakness in perspective. Shares have declined 17% from their peak, but the sell-off was mostly orderly and took shares back to their rising 200-day moving average.
Shares were able to hold that key support area but have consistently made lower highs since its February peak. It also sits at its 50-day moving average, which is also starting to turn over. So things are at a near-term crossroads.
Clearly, earnings will be the catalyst to help shares make their next move. The moving average convergence/divergence (MACD) has triggered a buy signal and reached its lowest levels in two years. That is a positive development and could lead to an upswing that breaks the recent trend and gets shares back on a path to new highs.
Last, But Not Least, Intercontinental Exchange Group (ICE)
ICE, the parent company of the NYSE, has benefited from market volatility and expanding trading volumes. Shares are up 6.1% year-to-date and over 21% over the last 52-weeks.
FIGURE 3. DAILY CHART OF ICE. The stock price may face some headwinds, but a break above $167 will be positive for the stock.
Shares had been on a tear before mid-March. Then the market turned and took ICE shares with it. However, the sell-off took shares to critical technical levels where they held. The stock closed under its 200-day moving average for six days on its last trip below the level. Ironically, it did the same thing in early January and then rallied.
Now that the big test of the long-term uptrend was successful again, we head into earnings hoping it can build from this level. A risk/reward set-up is quite favorable if we use a level just under the 200-day for a stop loss.
The upside has minor challenges as well, but the path of least resistance looks higher. Any gap or rally over $167 should lead to a momentum surge higher. Its MACD just triggered a buy signal, and a solid earnings report should take shares to their old highs.
Final Thoughts
While the big tech names will dominate the headlines this week, it’s often the lesser-watched stocks that quietly outperform. KO, Visa, and ICE all have compelling stories and interesting technical setups going into earnings. If you’re looking for opportunities beyond the big tech stocks, these could be worth a closer look.


